
In this tutorial I describe how to configure STM32F4 in-circuit debugging environment using open source tools like GDB or Eclipse. This tutorial is based on the Template Project with Generic Makefile.

1. Prerequisites
- Ubuntu 14.04 LTS (x86 architecture).
- STM32F4 Discovery Board (ARM architecture, costs less than 20 EUR).
- Complete the Template Project with Generic Makefile.
- Or at least go through chapter 2. Below is a quick-and-dirty instruction summary if you decide to stay on this page.
cd ~
# Remove the official package
sudo apt-get purge binutils-arm-none-eabi \
                   gcc-arm-none-eabi \
                   gdb-arm-none-eabi \
                   libnewlib-arm-none-eabi

# Add 3rd party repository
sudo add-apt-repository ppa:terry.guo/gcc-arm-embedded
sudo apt-get update
# Check the GCC package version in the PPA repository
sudo apt-cache policy gcc-arm-none-eabi

# Install software requirements
sudo apt-get install build-essential git openocd \
 gcc-arm-none-eabi qemu-system-arm \
 symlinks expect

# Clone my git repository and init submodules
git clone https://github.com/istarc/stm32.git
cd ~/stm32
git submodule update --init
2. Install Software Dependencies
Install Eclipse CDT and some OpenOCD build dependencies via apt-get.
sudo apt-get install eclipse-cdt libtool libftdi-dev \
                     libusb-1.0-0-dev \
                     automake pkg-config texinfo
Check your current version of OpenOCD.
openocd --version
If your package version is less than 0.9.0, then I recommend you to build the program the from the source in 7 very simple steps as follows (due to some issues with STM32F4).
# Clone OpenOCD project
git clone \
    git://openocd.git.sourceforge.net/gitroot/openocd/openocd

# Configure OpenOCD
cd ~/openocd
./bootstrap
./configure --enable-maintainer-mode \
            --disable-option-checking \
            --disable-werror \
            --prefix=/opt/openocd \
            --enable-dummy \
            --enable-usb_blaster_libftdi \
            --enable-ep93xx \
            --enable-at91rm9200 \
            --enable-presto_libftdi \
            --enable-usbprog \
            --enable-jlink \
            --enable-vsllink \
            --enable-rlink \
            --enable-stlink \
            --enable-arm-jtag-ew

# Build and Deploy the OpenOCD project (/opt/openocd)
make # Build
sudo make install # Install
3. Build the Project
Now, build the project with debug configuration instead of release. It will add additional debug information.
cd ~/stm32/STM32F4-Discovery_FW_V1.1.0/Project
cd Peripheral_Examples/IO_Toogle

make clean
make debug
4. Run the Debug Session
To run the debug session you have two options available:
- Either you go for command-line GDM;
- Or you use a graphical front-end it, for example Eclipse.
The first is easier to set up, but more difficult to use and vice versa.
4.1 Command-line GDB
Open two consoles (2x Ctrl+Alt+T).
Use the first console to start OpenOCD, which connects to the STM32F4 Discovery board and provides GDB server interface at localhost:3333.
# If you use the manually built OpenOCD version
sudo /opt/openocd/bin/openocd \
 -f /opt/openocd/share/openocd/scripts/board/stm32f4discovery.cfg \
 -c "init" -c "reset halt"

# If you use the official OpenOCD package
# sudo openocd \
# -f /usr/share/openocd/scripts/board/stm32f4discovery.cfg \
# -c "init" -c "reset halt"
Use the second console to navigate to the IO Toggle project directory. Start the GDB client. First, you’ll connect to the localhost:3333 GDB server. Second, you’ll program the STM32F4 device via GDB. Finally, you’ll use in-circuit debugger.
cd ~/stm32/STM32F4-Discovery_FW_V1.1.0/Project
cd Peripheral_Examples/IO_Toogle
arm-none-eabi-gdb
# PROGRAM THE DEVICE
(gdb) target remote localhost:3333 # Connect to the OpenOCD GDB server
(gdb) monitor reset halt # Reset and Stop
(gdb) monitor flash protect 0 0 11 off # Disable Flash Protection
(gdb) !find `pwd` -name *.elf # Find elf file /w absolute path
/complete/absolute/path/to/iotoggle.elf
(gdb) monitor flash write_image erase "/complete/absolute/path/to/iotoggle.elf"
# SOMETHING JUST FOR FUN
(gdb) monitor reset run # Reset and Run
# DEBUG THE PROGRAM
(gdb) monitor reset halt
(gdb) file iotoggle.elf # Select Binary to Debug
(gdb) load # Load Debugging Symbols
(gdb) break main.c:85 # Setup a breakpoint
(gdb) continue # Wait until triggered
Breakpoint 1, main () at main.c:85
85 GPIO_SetBits(GPIOD, GPIO_Pin_14);
(gdb) disconnect
(gdb) quit
4.2 GDB with Graphical Interface in Eclipse
Open up a console (Ctrl+Alt+T). Start OpenOCD program to connect to the STM32F4 Discovery board. The command resets the processor and halts its execution. Furthermore, it starts GDB server available at localhost:3333.
sudo /opt/openocd/bin/openocd \
 -f /opt/openocd/share/openocd/scripts/board/stm32f4discovery.cfg \
 -c "init" -c "reset halt"

# If you use the official OpenOCD package
# sudo openocd \
# -f /usr/share/openocd/scripts/board/stm32f4discovery.cfg \
# -c "init" -c "reset halt"
4.2.1 Create New Eclipse Project
Start Eclipse and create a new Makefile project with existing code (File->New->Makefile Project with Existing Code). According to the figure below navigate to existing IO Toggle project location, uncheck C++ language and select Cross GCC toolchain.

4.2.2 Build the IO Toggle Project
The Makefile already includes standard build configuration that are supported by Eclipse out of the box. You can build and clean the project by Project->Build All and Project->Clean, respectively. These two invoke “make all” and “make clean” commands. To invoke “make debug” command create a custom make target by pressing Shift+F9 and add a new target names with title “debug”, “release” and “clean”.

Now, press Shift+F9 and invoke “clean” and then “debug”. The Eclipse should build the IO Toggle project with debug configuration instead of release.
4.2.3 Install Zylin GDB debug plug-in for embedded system
Trust me, it’s easier to use this plug-in than wrestle with default Eclipse debug configuration wizard, because it allows custom GDB commands to be used at debug session initialization. To install the plug-in run Help->Install New Software… Then add the following repository http://opensource.zylin.com/zylincdt (see the figure below).

4.2.3 Setup Debug Configuration
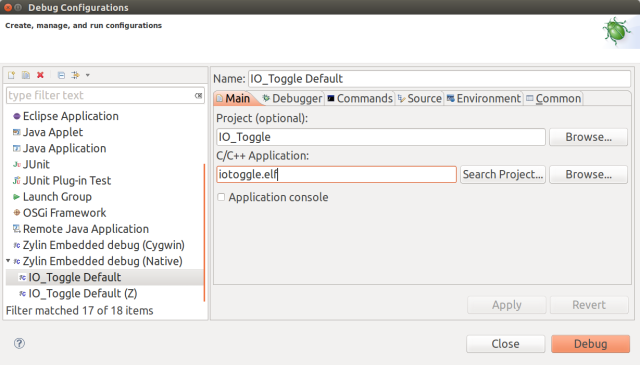
Setup debug configuration by running Run->Debug Configurations… Next, create a new Zylin Embedded Debug (Native) configuration.
- In the Main tab add “iotoggle.elf” application.
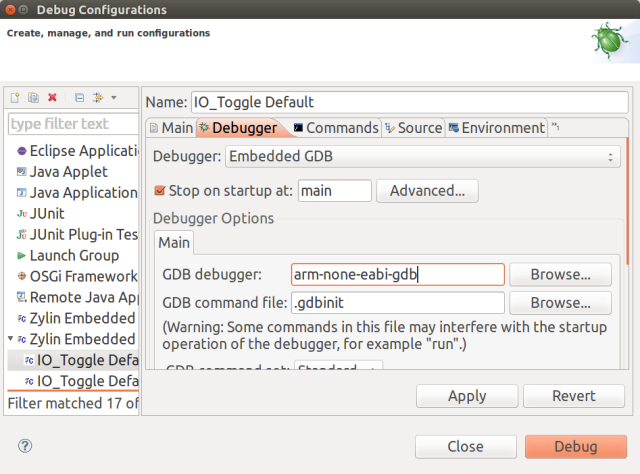
- In the Debugger tab (Main subtab) replace gdb-elf-arm with arm-none-eabi-gdb.
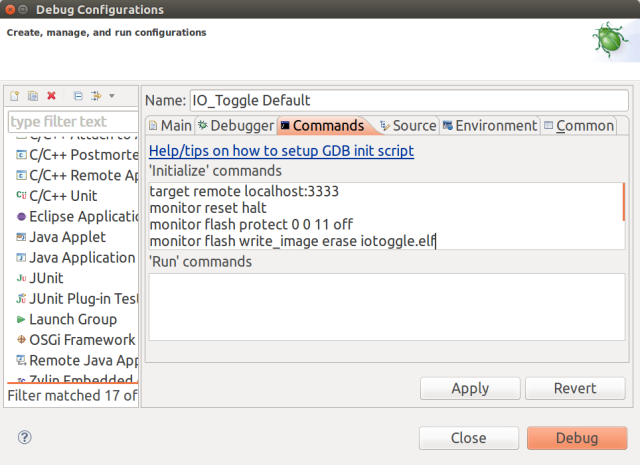
- Copy & paste the script below into the GDB Initialization Commands section (see the figure below). The script is based on the command-line initialization procedure from section 4.1.
target remote localhost:3333
monitor reset halt
monitor flash protect 0 0 11 off
monitor flash write_image erase iotoggle.elf
monitor reset halt
file iotoggle.elf
load
- And you are ready to go!


4.2.4 Start Debugger
Run->Debug Configurations…., select IO Toggle Default and start debugging!
No hurry now, take your time and play with the debugger. Click F6 to step over the source. Create a hardware breakpoint at main.c:70. Resume execution F8. Observe toggling LEDs and how processors stop at main.c:70 again.

You’ll thank me later. 🙂
4.2.4 Improve Some Things Here and There … (Syntax Checking & Autocomplete)
You’ll notice that Eclipse IDE has some unresolved inclusions. Certain code section are underlined red, even though the code builds correctly. Why? Eclipse is missing appropriate header files. Let’s add them via Project->Properties->C/C++ General->Paths and Symbols. Select GNU C and click Add->File system. Now, add include directories from the Makefile (see the figure below).

The index should rebuild automatically and syntactic error warnings should disappears. Now, you can jump to data structure definitions using F3 key or use autocomplete.
4. Further Reading
Check out In-circuit Debugging [revisited] tutorial, which is easier to setup, easier to use and is based on a newer version of Eclipse.
5. References
This tutorial is based on Benjamin’s robotics blog on “Debugging the STM32F4 using openocd, gdb and Eclipse“. The capt. Piccard meme is from is from cheezburger.com.

Hey,
I was following your tutorial and I got an error. I wanted to initialize gdb on eclipse.
This is what I get when I try to debug:
source .gdbinit
.gdbinit: No such file or directory.
target remote localhost:3333
localhost:3333: Connection timed out.
monitor reset halt
“monitor” command not supported by this target.
monitor flash protect 0 0 11 off
“monitor” command not supported by this target.
monitor flash write_image erase iotoggle.elf
“monitor” command not supported by this target.
monitor reset halt
“monitor” command not supported by this target.
file iotoggle.elf
Reading symbols from iotoggle.elf…done.
load
You can’t do that when your target is `exec’
I am on ubuntu. Everything so far worked well. I managed to add libraries later on too.
Hi Gabriele, I recommend you to check the updated In-circuit Debugging blog at https://istarc.wordpress.com/2014/11/03/stm32f4-in-circuit-debugging-revisited/, where I use different Eclipse plug-in, i.e. GNU ARM Eclipse C/C++ Cross Development Tools instead of Zylin Embedded CDT. Good luck and best regards, Iztok